How Flux Density Affects FeNi Powder Core Loss at 1 MHz
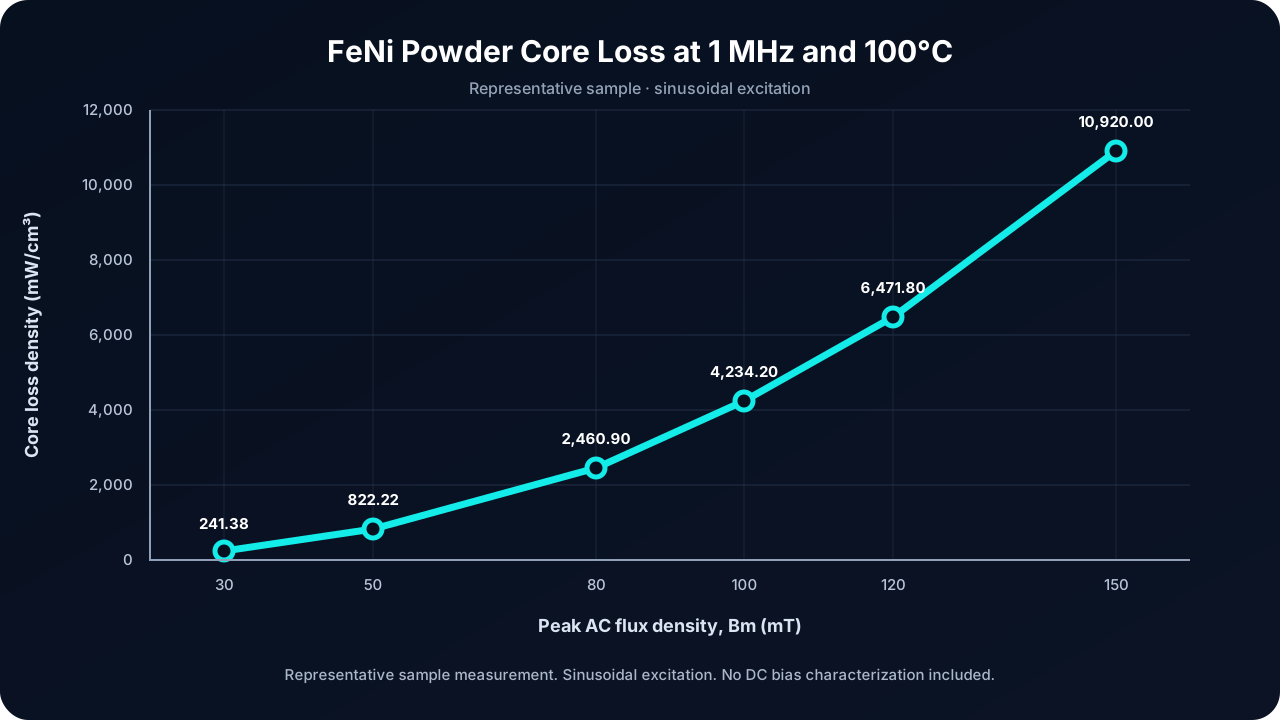
In one representative FeNi powder core sample tested at 1 MHz, 100°C, and sinusoidal excitation, reducing peak AC flux density from 100 mT to 50 mT reduced measured core loss density from 4,234.20 to 822.22 mW/cm³—about 80.6%. This sample result is not a production guarantee and does not include DC bias characterization.
When evaluating a magnetic material for a high-frequency power inductor, a core loss number only becomes useful when its test conditions are clear.
Frequency, flux density, temperature, and excitation waveform all need to be considered. A measurement at 1 MHz and 30 mT answers a different design question from a measurement at 1 MHz and 100 mT.
In a YUTE Magnetics laboratory test, one FeNi powder core sample showed a core loss density of 822.22 mW/cm³ at 1 MHz, 50 mT, and 100°C. At the same frequency and temperature, increasing the peak flux density to 100 mT raised the measured loss density to 4,234.20 mW/cm³.
These results show why flux density deserves close attention during high-frequency magnetic material evaluation.
Measured Core Loss at 1 MHz
The following measurements came from the same representative FeNi powder core sample under sinusoidal excitation at a test frequency of 1 MHz and a temperature of 100°C.
| Frequency | Peak flux density, Bm | Core loss density |
|---|---|---|
| 1 MHz | 30 mT | 241.38 mW/cm³ |
| 1 MHz | 50 mT | 822.22 mW/cm³ |
| 1 MHz | 80 mT | 2,460.90 mW/cm³ |
| 1 MHz | 100 mT | 4,234.20 mW/cm³ |
| 1 MHz | 120 mT | 6,471.80 mW/cm³ |
| 1 MHz | 150 mT | 10,920.00 mW/cm³ |
Representative sample measurement. Sinusoidal excitation. No DC bias characterization included.
Bm refers to the peak AC flux density in this test. It is not a peak-to-peak value.
The values are representative sample measurements, rather than guaranteed production limits. The source unit, kW/m³, is numerically equivalent to mW/cm³.
Halving Flux Density Reduced Measured Loss by About 81%
Reducing Bm from 100 mT to 50 mT lowered the measured core loss density from 4,234.20 to 822.22 mW/cm³—a reduction of approximately 80.6%.
Conversely, doubling Bm from 50 mT to 100 mT increased loss density by approximately 5.15 times.
For an engineer reviewing a high-frequency inductor, this is a useful reason to examine the intended flux swing early in the design process. A change in operating flux density can substantially change the core loss estimate.
The 80.6% figure applies only to core loss density in this representative sample under the stated test conditions. It does not represent an equivalent improvement in converter efficiency or a measured reduction in component temperature.
Compare Materials at the Operating Point You Need
A material comparison should use matching conditions wherever possible:
- Switching or excitation frequency
- AC flux density, with peak and peak-to-peak definitions stated
- Core temperature
- Excitation waveform
- DC bias condition
- Measurement method and sample geometry
This dataset covers sinusoidal excitation. It does not include DC bias characterization, so the results alone cannot establish inductance retention or loss behavior in a biased power inductor.
For DC-DC converters, VRM stages, and other high-current applications, the next evaluation should therefore include the required DC operating point and the actual waveform.
Core Loss Density Is One Part of the Thermal Calculation
Estimated core loss = core loss density × effective core volume
For example, using a hypothetical effective core volume of 0.1 cm³:
| Test condition | Estimated core loss |
|---|---|
| 1 MHz, 50 mT, 100°C | 0.082 W |
| 1 MHz, 100 mT, 100°C | 0.423 W |
This example assumes the same loss density throughout the core. It illustrates the volume conversion and is not a measured result for a finished inductor.
Component temperature still needs to be evaluated with winding losses, geometry, cooling conditions, and the complete assembly.
Evaluate the Material Before Finalizing the Geometry
The practical question is whether a material can meet the loss, inductance, size, and temperature requirements at the intended operating point.
YUTE Magnetics manufactures FeNi powder cores and high-frequency power inductors and supports custom geometry development for material and component evaluation.
If you are reviewing a high-frequency power inductor or evaluating an alternative core material, review our material data resources or share your target frequency, current, inductance, size constraints, and operating temperature. Our team can provide available material data and discuss a suitable prototype evaluation.
Free customized validation samples are available for eligible projects, with a prototype turnaround as fast as approximately 15 days, depending on geometry and project requirements.
Related pages
Need help choosing the right core?
Send the operating point and the mechanical envelope — we will come back with a core and a winding proposal.